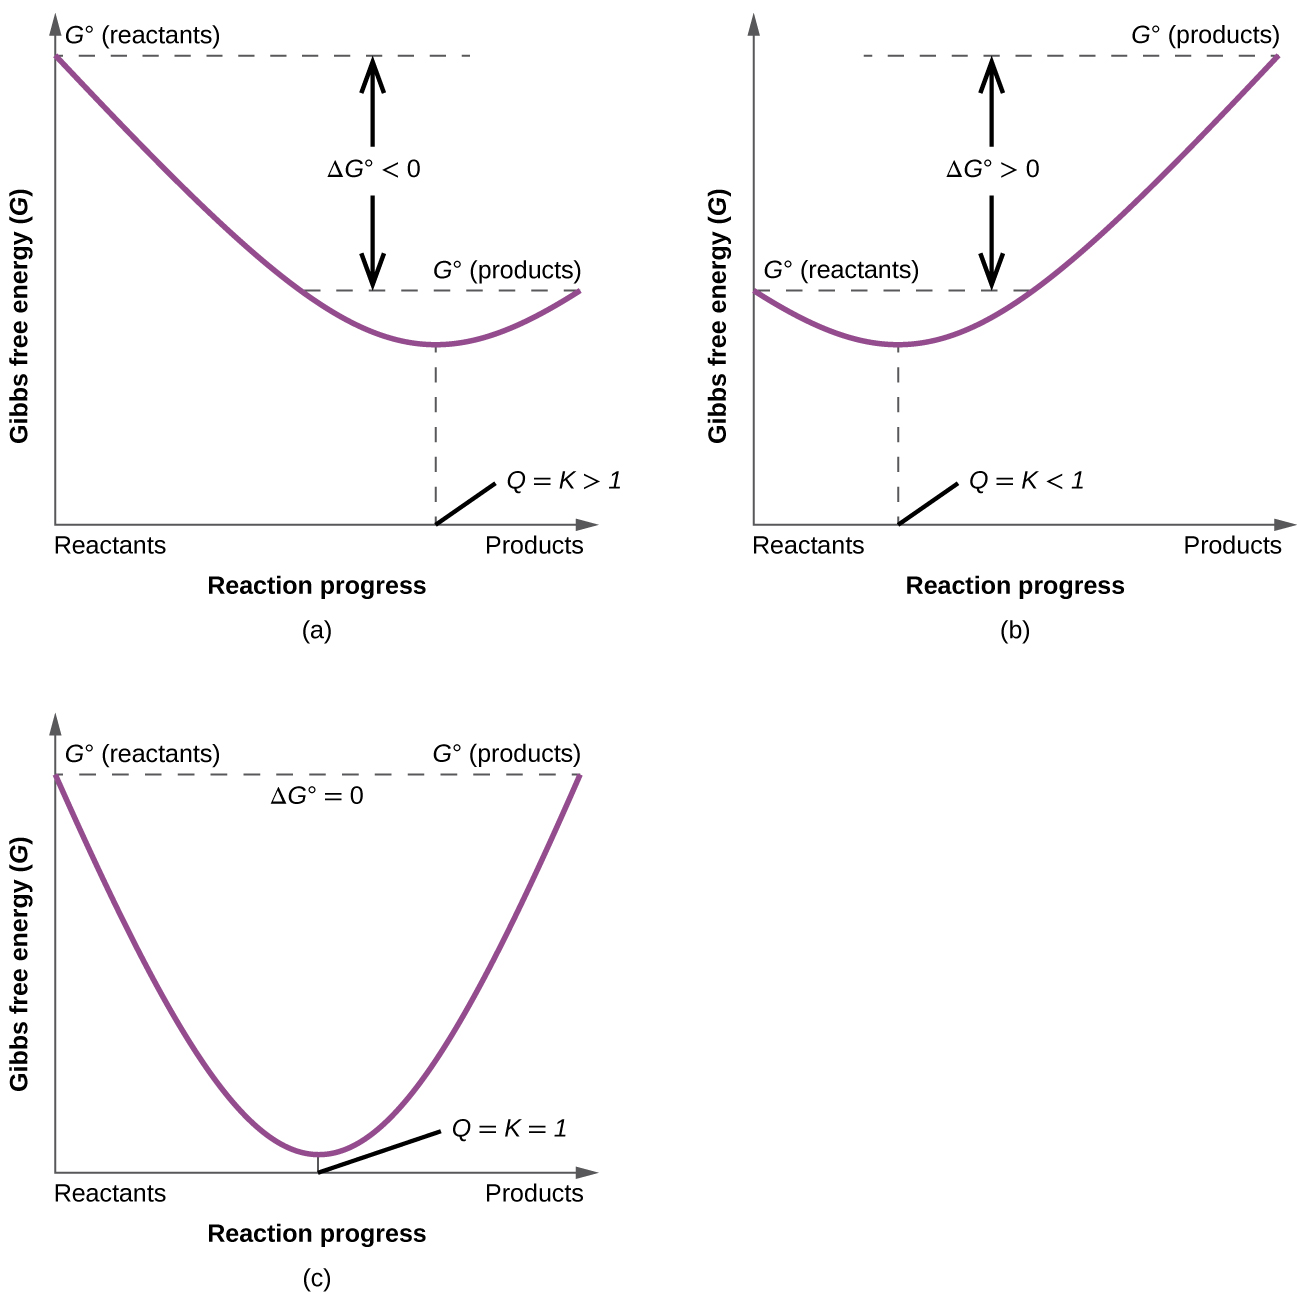
These plots show the free energy versus reaction progress for systems whose standard free changes are (a) negative, (b) positive, and (c) zero. Nonequilibrium systems will proceed spontaneously in whatever direction is necessary to minimize free energy and establish equilibrium.
Key concepts and summary
Gibbs free energy (
G ) is a state function defined with regard to system quantities only and may be used to predict the spontaneity of a process. A negative value for Δ
G indicates a spontaneous process; a positive Δ
G indicates a nonspontaneous process; and a Δ
G of zero indicates that the system is at equilibrium. A number of approaches to the computation of free energy changes are possible.
Key equations
Δ
G = Δ
H −
T Δ
S
Δ
G = Δ
G ° +
RT ln
Q
Δ
G ° = −
RT ln
K
Chemistry end of chapter exercises
What is the difference between Δ
G , Δ
G °, and
for a chemical change?
A reactions has
= 100 kJ/mol and
Is the reaction spontaneous at room temperature? If not, under what temperature conditions will it become spontaneous?
The reaction is nonspontaneous at room temperature.
Above 400 K, Δ
G will become negative, and the reaction will become spontaneous.
Use the standard free energy of formation data in
Appendix G to determine the free energy change for each of the following reactions, which are run under standard state conditions and 25 °C. Identify each as either spontaneous or nonspontaneous at these conditions.
Use the standard free energy data in
Appendix G to determine the free energy change for each of the following reactions, which are run under standard state conditions and 25 °C. Identify each as either spontaneous or nonspontaneous at these conditions.
(a) Determine the standard free energy of formation,
for phosphoric acid.
(b) How does your calculated result compare to the value in
Appendix G ? Explain.
(a) −1124.3 kJ/mol for the standard free energy change. (b) The calculation agrees with the value in
Appendix G because free energy is a state function (just like the enthalpy and entropy), so its change depends only on the initial and final states, not the path between them.
In economics, a perfect market refers to a theoretical construct where all participants have perfect information, goods are homogenous, there are no barriers to entry or exit, and prices are determined solely by supply and demand. It's an idealized model used for analysis,
When MP₁ becomes negative, TP start to decline.
Extuples Suppose that the short-run production function of certain cut-flower firm is given by: Q=4KL-0.6K2 - 0.112 •
Where is quantity of cut flower produced, I is labour input and K is fixed capital input (K-5). Determine the average product of lab
Kelo
Extuples Suppose that the short-run production function of certain cut-flower firm is given by: Q=4KL-0.6K2 - 0.112 •
Where is quantity of cut flower produced, I is labour input and K is fixed capital input (K-5). Determine the average product of labour (APL) and marginal product of labour (MPL)
Quantity demanded refers to the specific amount of a good or service that consumers are willing and able to purchase at a give price and within a specific time period. Demand, on the other hand, is a broader concept that encompasses the entire relationship between price and quantity demanded
Ezea
ok
Shukri
how do you save a country economic situation when it's falling apart
Economic growth as an increase in the production and consumption of goods and services within an economy.but
Economic development as a broader concept that encompasses not only economic growth but also social & human well being.
Shukri
production function means
Jabir
What do you think is more important to focus on when considering inequality ?
sir...I just want to ask one question... Define the term contract curve? if you are free please help me to find this answer 🙏
Asui
it is a curve that we get after connecting the pareto optimal combinations of two consumers after their mutually beneficial trade offs
Awais
thank you so much 👍 sir
Asui
In economics, the contract curve refers to the set of points in an Edgeworth box diagram where both parties involved in a trade cannot be made better off without making one of them worse off. It represents the Pareto efficient allocations of goods between two individuals or entities, where neither p
Cornelius
In economics, the contract curve refers to the set of points in an Edgeworth box diagram where both parties involved in a trade cannot be made better off without making one of them worse off. It represents the Pareto efficient allocations of goods between two individuals or entities,
Cornelius
Suppose a consumer consuming two commodities X and Y has
The following utility function u=X0.4 Y0.6. If the price of the X and Y are 2 and 3 respectively and income Constraint is birr 50.
A,Calculate quantities of x and y which maximize utility.
B,Calculate value of Lagrange multiplier.
C,Calculate quantities of X and Y consumed with a given price.
D,alculate optimum level of output .
the market for lemon has 10 potential consumers, each having an individual demand curve p=101-10Qi, where p is price in dollar's per cup and Qi is the number of cups demanded per week by the i th consumer.Find the market demand curve using algebra. Draw an individual demand curve and the market dema
suppose the production function is given by ( L, K)=L¼K¾.assuming capital is fixed find APL and MPL. consider the following short run production function:Q=6L²-0.4L³ a) find the value of L that maximizes output b)find the value of L that maximizes marginal product
Abdureman
Got questions? Join the online conversation and get instant answers!