<< Chapter < Page Chapter >> Page >

PV Diagrams and their relationship to work done on or by a gas

A process by which a gas does work on a piston at constant pressure is called an isobaric process    . Since the pressure is constant, the force exerted is constant and the work done is given as

P Δ V . size 12{PΔV} {}
The diagram shows an isobaric expansion of a gas filled cylinder held vertically. V is the volume of gas in the cylinder. A is the area of cross section of the cylinder. The cylinder has a movable piston with a rod attached to it at the top of the cylinder. A heat Q sub in is shown to enter the cylinder from below. A force F equals P times A is shown to act upward from the bottom of the cylinder. The piston is shown to have been displaced by a vertical distance d upward. The volume displaced is given by delta V equals A times d. The work output shown as W sub out is equal to F times d, which is also equal to P times A times d, which in turn equals P times delta V.
An isobaric expansion of a gas requires heat transfer to keep the pressure constant. Since pressure is constant, the work done is P Δ V size 12{PΔV} {} .
W = Fd size 12{W= ital "Fd"} {}

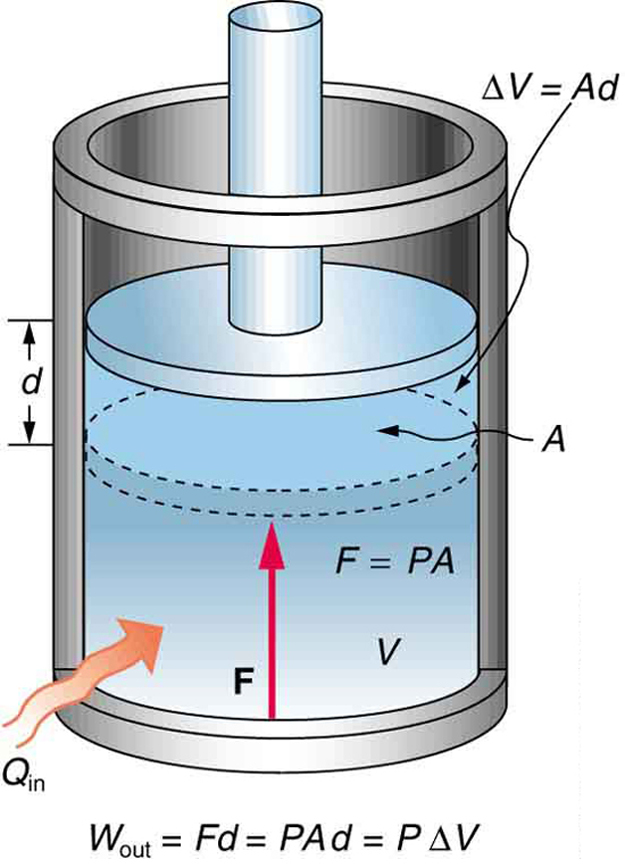
See the symbols as shown in [link] . Now F = PA size 12{F= ital "PA"} {} , and so

W = PAd . size 12{W= ital "PAd"} {}

Because the volume of a cylinder is its cross-sectional area A size 12{A} {} times its length d size 12{d} {} , we see that Ad = Δ V size 12{ ital "Ad"=ΔV} {} , the change in volume; thus,

W = P Δ V  (isobaric process). size 12{W=PΔV} {}

Note that if Δ V size 12{ΔV} {} is positive, then W size 12{W} {} is positive, meaning that work is done by the gas on the outside world.

(Note that the pressure involved in this work that we've called P size 12{P} {} is the pressure of the gas inside the tank. If we call the pressure outside the tank P ext size 12{P rSub { size 8{"ext"} } } {} , an expanding gas would be working against the external pressure; the work done would therefore be W = P ext Δ V size 12{W= - P rSub { size 8{"ext"} } ΔV} {} (isobaric process). Many texts use this definition of work, and not the definition based on internal pressure, as the basis of the First Law of Thermodynamics. This definition reverses the sign conventions for work, and results in a statement of the first law that becomes Δ U = Q + W size 12{ΔU=Q+W} {} .)

It is not surprising that W = P Δ V size 12{W=PΔV} {} , since we have already noted in our treatment of fluids that pressure is a type of potential energy per unit volume and that pressure in fact has units of energy divided by volume. We also noted in our discussion of the ideal gas law that PV size 12{ ital "PV"} {} has units of energy. In this case, some of the energy associated with pressure becomes work.

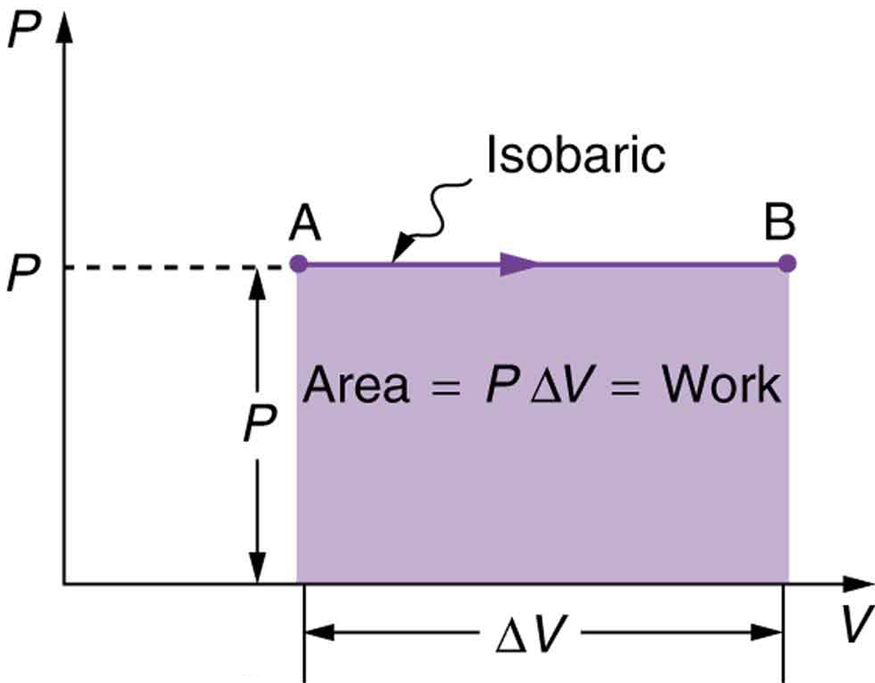
[link] shows a graph of pressure versus volume (that is, a PV size 12{ ital "PV"} {} diagram for an isobaric process. You can see in the figure that the work done is the area under the graph. This property of PV size 12{ ital "PV"} {} diagrams is very useful and broadly applicable: the work done on or by a system in going from one state to another equals the area under the curve on a PV size 12{ ital "PV"} {} diagram .

The graph of pressure verses volume is shown for a constant pressure. The pressure P is along the Y axis and the volume is along the X axis. The graph is a straight line parallel to the X axis for a value of pressure P. Two points are marked on the graph at either end of the line as A and B. A is the starting point of the graph and B is the end point of graph. There is an arrow pointing from A to B. The term isobaric is written on the graph. For a length of graph equal to delta V the area of the graph is shown as a shaded area given by P times delta V which is equal to work W.
A graph of pressure versus volume for a constant-pressure, or isobaric, process, such as the one shown in [link] . The area under the curve equals the work done by the gas, since W = P Δ V size 12{W=PΔV} {} .
The diagram in part a shows a pressure versus volume graph. The pressure is along the Y axis and the volume is along the X axis. The curve is a smooth falling curve from the highest point A to the lowest point B. The curve is segmented into small vertical rectangular sections of equal width. One of the sections is marked as width of delta V sub one along the X axis. The pressure P sub one average multiplied by delta V sub one gives the work done for that strip of the graph. Part b of the figure shows a similar graph for the reverse path. The curve now slopes upward from point A to point B. An equation in the top right of the graph reads W sub in equals the opposite of W sub out for the same path.
(a) A PV size 12{ ital "PV"} {} diagram in which pressure varies as well as volume. The work done for each interval is its average pressure times the change in volume, or the area under the curve over that interval. Thus the total area under the curve equals the total work done. (b) Work must be done on the system to follow the reverse path. This is interpreted as a negative area under the curve.

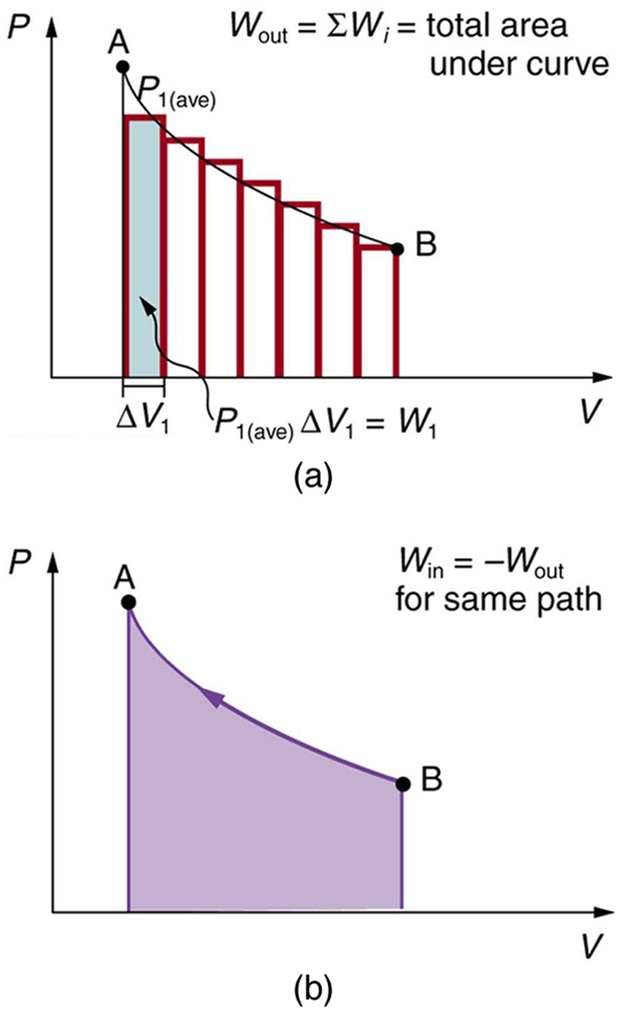
We can see where this leads by considering [link] (a), which shows a more general process in which both pressure and volume change. The area under the curve is closely approximated by dividing it into strips, each having an average constant pressure P i ( ave ) size 12{P rSub { size 8{i \( "ave" \) } } } {} . The work done is W i = P i ( ave ) Δ V i size 12{W rSub { size 8{i} } =P rSub { size 8{i \( "ave" \) } } DV rSub { size 8{i} } } {} for each strip, and the total work done is the sum of the W i size 12{W rSub { size 8{i} } } {} . Thus the total work done is the total area under the curve. If the path is reversed, as in [link] (b), then work is done on the system. The area under the curve in that case is negative, because Δ V size 12{ΔV} {} is negative.

Questions & Answers

calculate molarity of NaOH solution when 25.0ml of NaOH titrated with 27.2ml of 0.2m H2SO4
Gasin Reply
what's Thermochemistry
rhoda Reply
the study of the heat energy which is associated with chemical reactions
Kaddija
How was CH4 and o2 was able to produce (Co2)and (H2o
Edafe Reply
explain please
Victory
First twenty elements with their valences
Martine Reply
what is chemistry
asue Reply
what is atom
asue
what is the best way to define periodic table for jamb
Damilola Reply
what is the change of matter from one state to another
Elijah Reply
what is isolation of organic compounds
IKyernum Reply
what is atomic radius
ThankGod Reply
Read Chapter 6, section 5
Dr
Read Chapter 6, section 5
Kareem
Atomic radius is the radius of the atom and is also called the orbital radius
Kareem
atomic radius is the distance between the nucleus of an atom and its valence shell
Amos
Read Chapter 6, section 5
paulino
Bohr's model of the theory atom
Ayom Reply
is there a question?
Dr
when a gas is compressed why it becomes hot?
ATOMIC
It has no oxygen then
Goldyei
read the chapter on thermochemistry...the sections on "PV" work and the First Law of Thermodynamics should help..
Dr
Which element react with water
Mukthar Reply
Mgo
Ibeh
an increase in the pressure of a gas results in the decrease of its
Valentina Reply
definition of the periodic table
Cosmos Reply
What is the lkenes
Da Reply
what were atoms composed of?
Moses Reply
Got questions? Join the online conversation and get instant answers!
Jobilize.com Reply
Practice Key Terms 6

Get Jobilize Job Search Mobile App in your pocket Now!

Get it on Google Play Download on the App Store Now


Source:  OpenStax, College physics for ap® courses. OpenStax CNX. Nov 04, 2016 Download for free at https://legacy.cnx.org/content/col11844/1.14
Google Play and the Google Play logo are trademarks of Google Inc.

Notification Switch

Would you like to follow the 'College physics for ap® courses' conversation and receive update notifications?

Ask