<< Chapter < Page Chapter >> Page >
Figure a shows the Earth and the Moon around it orbiting in a circular path shown here as a circle around the Earth with an arrow over it showing the counterclockwise direction of the Moon. The center of mass of the circle is shown here with a point on the Earth that is not the Earth’s center but just right to its center. Figure b shows the Sun and the counterclockwise rotation of the Earth around it, in an elliptical path, which has wiggles. Along this path the center of mass of the Earth-Moon is also shown; it follows non-wiggled elliptical path.
(a) Earth and the Moon rotate approximately once a month around their common center of mass. (b) Their center of mass orbits the Sun in an elliptical orbit, but Earth’s path around the Sun has “wiggles” in it. Similar wiggles in the paths of stars have been observed and are considered direct evidence of planets orbiting those stars. This is important because the planets’ reflected light is often too dim to be observed.

Tides

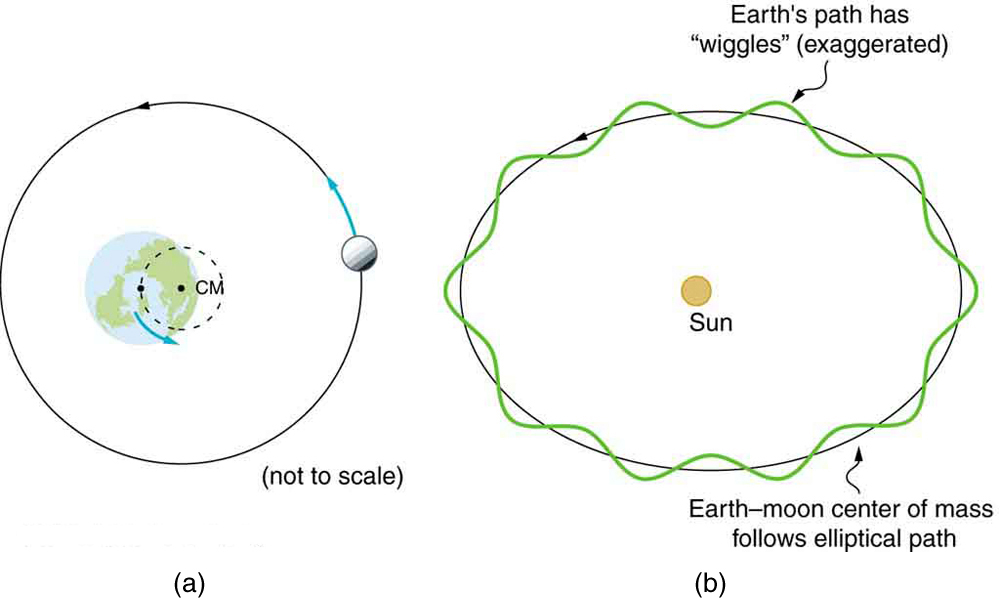
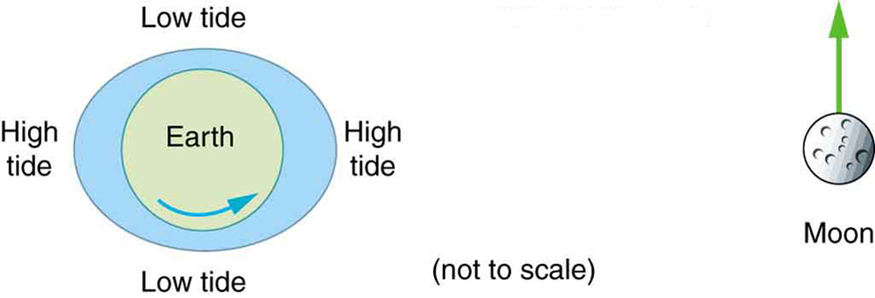
Ocean tides are one very observable result of the Moon’s gravity acting on Earth. [link] is a simplified drawing of the Moon’s position relative to the tides. Because water easily flows on Earth’s surface, a high tide is created on the side of Earth nearest to the Moon, where the Moon’s gravitational pull is strongest. Why is there also a high tide on the opposite side of Earth? The answer is that Earth is pulled toward the Moon more than the water on the far side, because Earth is closer to the Moon. So the water on the side of Earth closest to the Moon is pulled away from Earth, and Earth is pulled away from water on the far side. As Earth rotates, the tidal bulge (an effect of the tidal forces between an orbiting natural satellite and the primary planet that it orbits) keeps its orientation with the Moon. Thus there are two tides per day (the actual tidal period is about 12 hours and 25.2 minutes), because the Moon moves in its orbit each day as well).

The given figure shows an ellipse, inside which there is a circular image of the Earth. There is a curved arrow in the lower part of the Earth’s image pointing in the counterclockwise direction. The right and left side of the ellipse are labeled as High tide and the top and bottom side are labeled as Low tide. Alongside this image a circular image of the Moon is also given with dots showing the crates over it. A vertically upwards vector from its top is also shown, which indicates the direction of the Moon’s velocity.
The Moon causes ocean tides by attracting the water on the near side more than Earth, and by attracting Earth more than the water on the far side. The distances and sizes are not to scale. For this simplified representation of the Earth-Moon system, there are two high and two low tides per day at any location, because Earth rotates under the tidal bulge.

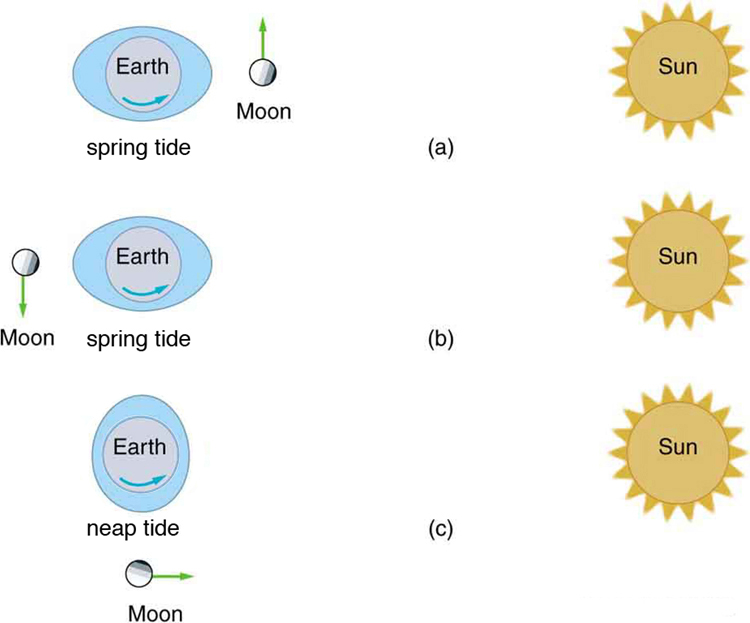
The Sun also affects tides, although it has about half the effect of the Moon. However, the largest tides, called spring tides, occur when Earth, the Moon, and the Sun are aligned. The smallest tides, called neap tides, occur when the Sun is at a 90º size 12{"90" rSup { size 8{ circ } } } {} angle to the Earth-Moon alignment.

Figure a shows an ellipse, inside which there is a circular image of the Earth. There is a curved arrow in the lower part of the Earth’s image pointing in the counterclockwise direction. Alongside this image a circular image of the Moon is also given with dots showing the crates over it. A vertically upward vector from its top is also drawn, which shows the direction of velocity. To the right side of the image, an image of the Sun is also shown, in a circular shape with pointed wiggles throughout its boundary. Figure b shows an ellipse, inside which there is a circular image of the Earth. There is a curved arrow in the lower part of the Earth’s image pointing in the counterclockwise direction. Alongside this image a circular image of the Moon is also given with dots showing the crates over it. A vertical downward vector from its bottom is also drawn, which shows the direction of velocity. To the right side of the image, an image of the Sun is also shown, in a circular shape and pointed wiggles throughout its boundary. Figure c shows an ellipse, inside which there is a circular image of the Earth. There is a curved arrow in the lower part of the Earth’s image pointing in the counterclockwise direction. Alongside this image a circular image of the Moon is also given with dots showing the crates over it. A horizontal rightward vector from its right side is also drawn, which shows the direction of velocity. To the right side of the image, an image of the Sun is also shown, in a circular shape and pointed wiggles throughout its boundary.
(a, b) Spring tides: The highest tides occur when Earth, the Moon, and the Sun are aligned. (c) Neap tide: The lowest tides occur when the Sun lies at 90º size 12{"90" rSup { size 8{ circ } } } {} to the Earth-Moon alignment. Note that this figure is not drawn to scale.

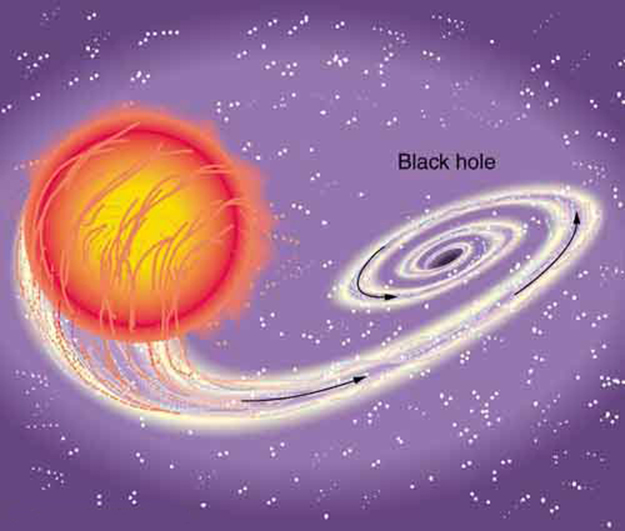
Tides are not unique to Earth but occur in many astronomical systems. The most extreme tides occur where the gravitational force is the strongest and varies most rapidly, such as near black holes (see [link] ). A few likely candidates for black holes have been observed in our galaxy. These have masses greater than the Sun but have diameters only a few kilometers across. The tidal forces near them are so great that they can actually tear matter from a companion star.

The figure shows a star in sky near a black hole. The tidal force of the black hole is tearing the matter from the star’s surface.
A black hole is an object with such strong gravity that not even light can escape it. This black hole was created by the supernova of one star in a two-star system. The tidal forces created by the black hole are so great that it tears matter from the companion star. This matter is compressed and heated as it is sucked into the black hole, creating light and X-rays observable from Earth.

Questions & Answers

A golfer on a fairway is 70 m away from the green, which sits below the level of the fairway by 20 m. If the golfer hits the ball at an angle of 40° with an initial speed of 20 m/s, how close to the green does she come?
Aislinn Reply
cm
tijani
what is titration
John Reply
what is physics
Siyaka Reply
A mouse of mass 200 g falls 100 m down a vertical mine shaft and lands at the bottom with a speed of 8.0 m/s. During its fall, how much work is done on the mouse by air resistance
Jude Reply
Can you compute that for me. Ty
Jude
what is the dimension formula of energy?
David Reply
what is viscosity?
David
what is inorganic
emma Reply
what is chemistry
Youesf Reply
what is inorganic
emma
Chemistry is a branch of science that deals with the study of matter,it composition,it structure and the changes it undergoes
Adjei
please, I'm a physics student and I need help in physics
Adjanou
chemistry could also be understood like the sexual attraction/repulsion of the male and female elements. the reaction varies depending on the energy differences of each given gender. + masculine -female.
Pedro
A ball is thrown straight up.it passes a 2.0m high window 7.50 m off the ground on it path up and takes 1.30 s to go past the window.what was the ball initial velocity
Krampah Reply
2. A sled plus passenger with total mass 50 kg is pulled 20 m across the snow (0.20) at constant velocity by a force directed 25° above the horizontal. Calculate (a) the work of the applied force, (b) the work of friction, and (c) the total work.
Sahid Reply
you have been hired as an espert witness in a court case involving an automobile accident. the accident involved car A of mass 1500kg which crashed into stationary car B of mass 1100kg. the driver of car A applied his brakes 15 m before he skidded and crashed into car B. after the collision, car A s
Samuel Reply
can someone explain to me, an ignorant high school student, why the trend of the graph doesn't follow the fact that the higher frequency a sound wave is, the more power it is, hence, making me think the phons output would follow this general trend?
Joseph Reply
Nevermind i just realied that the graph is the phons output for a person with normal hearing and not just the phons output of the sound waves power, I should read the entire thing next time
Joseph
Follow up question, does anyone know where I can find a graph that accuretly depicts the actual relative "power" output of sound over its frequency instead of just humans hearing
Joseph
"Generation of electrical energy from sound energy | IEEE Conference Publication | IEEE Xplore" ***ieeexplore.ieee.org/document/7150687?reload=true
Ryan
what's motion
Maurice Reply
what are the types of wave
Maurice
answer
Magreth
progressive wave
Magreth
hello friend how are you
Muhammad Reply
fine, how about you?
Mohammed
hi
Mujahid
A string is 3.00 m long with a mass of 5.00 g. The string is held taut with a tension of 500.00 N applied to the string. A pulse is sent down the string. How long does it take the pulse to travel the 3.00 m of the string?
yasuo Reply
Who can show me the full solution in this problem?
Reofrir Reply
Got questions? Join the online conversation and get instant answers!
Jobilize.com Reply
Practice Key Terms 4

Get Jobilize Job Search Mobile App in your pocket Now!

Get it on Google Play Download on the App Store Now


Source:  OpenStax, College physics. OpenStax CNX. Jul 27, 2015 Download for free at http://legacy.cnx.org/content/col11406/1.9
Google Play and the Google Play logo are trademarks of Google Inc.

Notification Switch

Would you like to follow the 'College physics' conversation and receive update notifications?

Ask