<< Chapter < Page Chapter >> Page >
Graphs of pressure versus volume at six different temperatures, T one through T five and T critical. T one is the lowest temperature and T five is the highest. T critical is in the middle. Graphs show that pressure per unit volume is greater for greater temperatures. Pressure decreases with increasing volume for all temperatures, except at low temperatures when pressure is constant with increasing volume during a phase change.
PV size 12{ ital "PV"} {} diagrams. (a) Each curve (isotherm) represents the relationship between P size 12{P} {} and V size 12{V} {} at a fixed temperature; the upper curves are at higher temperatures. The lower curves are not hyperbolas, because the gas is no longer an ideal gas. (b) An expanded portion of the PV size 12{ ital "PV"} {} diagram for low temperatures, where the phase can change from a gas to a liquid. The term “vapor” refers to the gas phase when it exists at a temperature below the boiling temperature.
Critical temperatures and pressures
Substance Critical temperature Critical pressure
K size 12{K} {} º C size 12{°C} {} Pa size 12{"Pa"} {} atm size 12{"atm"} {}
Water 647.4 374.3 22 . 12 × 10 6 size 12{"22" "." "12"×"10" rSup { size 8{6} } } {} 219.0
Sulfur dioxide 430.7 157.6 7 . 88 × 10 6 size 12{7 "." "88" times "10" rSup { size 8{6} } } {} 78.0
Ammonia 405.5 132.4 11 . 28 × 10 6 size 12{"11" "." "28"×"10" rSup { size 8{6} } } {} 111.7
Carbon dioxide 304.2 31.1 7 . 39 × 10 6 size 12{7 "." "39"×"10" rSup { size 8{6} } } {} 73.2
Oxygen 154.8 −118.4 5 . 08 × 10 6 size 12{5 "." "08"×"10" rSup { size 8{6} } } {} 50.3
Nitrogen 126.2 −146.9 3 . 39 × 10 6 size 12{3 "." "39"×"10" rSup { size 8{6} } } {} 33.6
Hydrogen 33.3 −239.9 1 . 30 × 10 6 size 12{1 "." "30"×"10" rSup { size 8{6} } } {} 12.9
Helium 5.3 −267.9 0 . 229 × 10 6 size 12{0 "." "229" times "10" rSup { size 8{6} } } {} 2.27

Phase diagrams

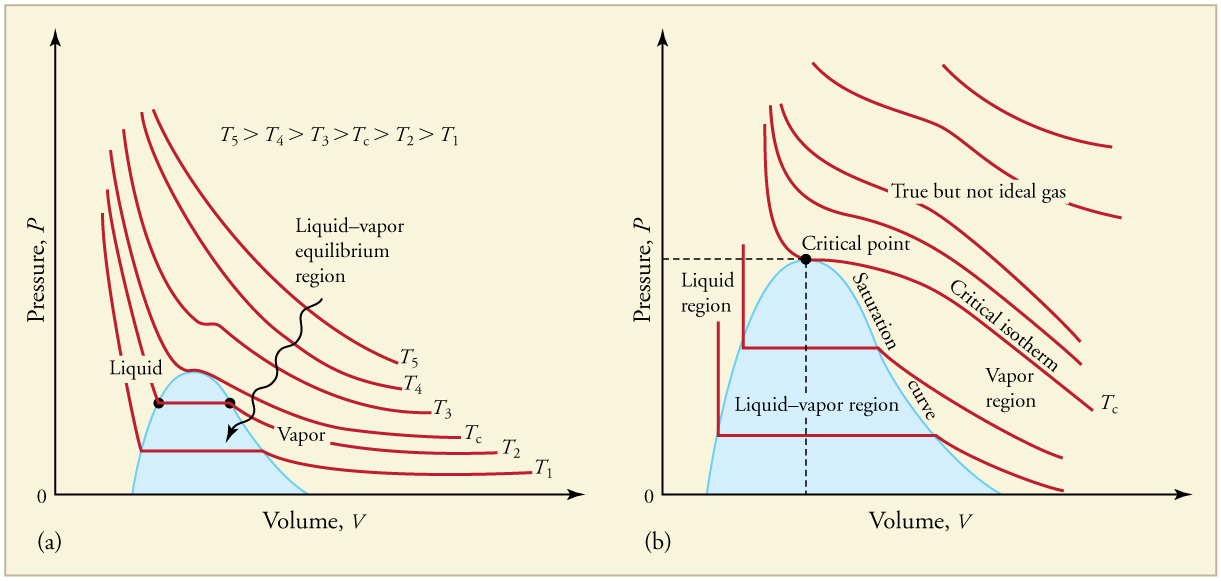
The plots of pressure versus temperatures provide considerable insight into thermal properties of substances. There are well-defined regions on these graphs that correspond to various phases of matter, so PT size 12{ ital "PT"} {} graphs are called phase diagrams . [link] shows the phase diagram for water. Using the graph, if you know the pressure and temperature you can determine the phase of water. The solid lines—boundaries between phases—indicate temperatures and pressures at which the phases coexist (that is, they exist together in ratios, depending on pressure and temperature). For example, the boiling point of water is 100 º C size 12{"100"°C} {} at 1.00 atm. As the pressure increases, the boiling temperature rises steadily to 374 º C size 12{"374"°C} {} at a pressure of 218 atm. A pressure cooker (or even a covered pot) will cook food faster because the water can exist as a liquid at temperatures greater than 100 º C size 12{"100"°C} {} without all boiling away. The curve ends at a point called the critical point , because at higher temperatures the liquid phase does not exist at any pressure. The critical point occurs at the critical temperature, as you can see for water from [link] . The critical temperature for oxygen is 118 º C size 12{ +- "118"°C} {} , so oxygen cannot be liquefied above this temperature.

Graph of pressure versus temperature showing the boundaries of the three phases of water, along with the triple point and critical point. The triple point, where all three phases exist, is at 0 point 006 atmospheres and 0 point 01 degrees C. The critical point is at two hundred eighteen atmospheres and three hundred seventy four degrees C. Solid water is in the P T region generally to the left (lower temperature, lower or higher pressure, from the triple point). Liquid water is generally above and to the right of the triple point (higher pressure, higher temperature). The region of water vapor is to the lower right of the triple point (lower pressure and temperature to higher temperature and pressure).
The phase diagram ( PT size 12{ ital "PT"} {} graph) for water. Note that the axes are nonlinear and the graph is not to scale. This graph is simplified—there are several other exotic phases of ice at higher pressures.

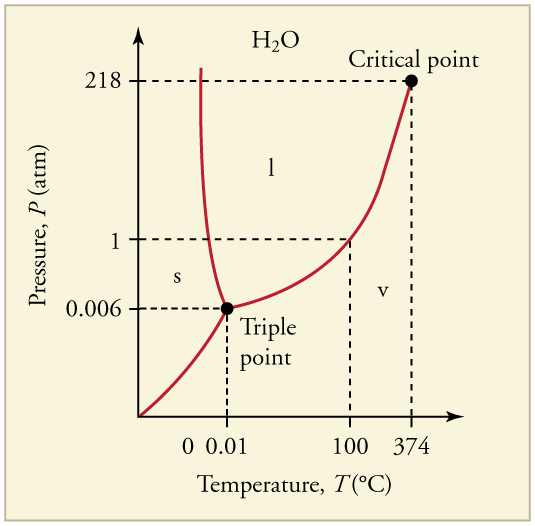
Similarly, the curve between the solid and liquid regions in [link] gives the melting temperature at various pressures. For example, the melting point is 0 º C size 12{0°C} {} at 1.00 atm, as expected. Note that, at a fixed temperature, you can change the phase from solid (ice) to liquid (water) by increasing the pressure. Ice melts from pressure in the hands of a snowball maker. From the phase diagram, we can also say that the melting temperature of ice rises with increased pressure. When a car is driven over snow, the increased pressure from the tires melts the snowflakes; afterwards the water refreezes and forms an ice layer.

At sufficiently low pressures there is no liquid phase, but the substance can exist as either gas or solid. For water, there is no liquid phase at pressures below 0.00600 atm. The phase change from solid to gas is called sublimation    . It accounts for large losses of snow pack that never make it into a river, the routine automatic defrosting of a freezer, and the freeze-drying process applied to many foods. Carbon dioxide, on the other hand, sublimates at standard atmospheric pressure of 1 atm. (The solid form of CO 2 size 12{"CO" rSub { size 8{2} } } {} is known as dry ice because it does not melt. Instead, it moves directly from the solid to the gas state.)

Questions & Answers

A golfer on a fairway is 70 m away from the green, which sits below the level of the fairway by 20 m. If the golfer hits the ball at an angle of 40° with an initial speed of 20 m/s, how close to the green does she come?
Aislinn Reply
cm
tijani
what is titration
John Reply
what is physics
Siyaka Reply
A mouse of mass 200 g falls 100 m down a vertical mine shaft and lands at the bottom with a speed of 8.0 m/s. During its fall, how much work is done on the mouse by air resistance
Jude Reply
Can you compute that for me. Ty
Jude
what is the dimension formula of energy?
David Reply
what is viscosity?
David
what is inorganic
emma Reply
what is chemistry
Youesf Reply
what is inorganic
emma
Chemistry is a branch of science that deals with the study of matter,it composition,it structure and the changes it undergoes
Adjei
please, I'm a physics student and I need help in physics
Adjanou
chemistry could also be understood like the sexual attraction/repulsion of the male and female elements. the reaction varies depending on the energy differences of each given gender. + masculine -female.
Pedro
A ball is thrown straight up.it passes a 2.0m high window 7.50 m off the ground on it path up and takes 1.30 s to go past the window.what was the ball initial velocity
Krampah Reply
2. A sled plus passenger with total mass 50 kg is pulled 20 m across the snow (0.20) at constant velocity by a force directed 25° above the horizontal. Calculate (a) the work of the applied force, (b) the work of friction, and (c) the total work.
Sahid Reply
you have been hired as an espert witness in a court case involving an automobile accident. the accident involved car A of mass 1500kg which crashed into stationary car B of mass 1100kg. the driver of car A applied his brakes 15 m before he skidded and crashed into car B. after the collision, car A s
Samuel Reply
can someone explain to me, an ignorant high school student, why the trend of the graph doesn't follow the fact that the higher frequency a sound wave is, the more power it is, hence, making me think the phons output would follow this general trend?
Joseph Reply
Nevermind i just realied that the graph is the phons output for a person with normal hearing and not just the phons output of the sound waves power, I should read the entire thing next time
Joseph
Follow up question, does anyone know where I can find a graph that accuretly depicts the actual relative "power" output of sound over its frequency instead of just humans hearing
Joseph
"Generation of electrical energy from sound energy | IEEE Conference Publication | IEEE Xplore" ***ieeexplore.ieee.org/document/7150687?reload=true
Ryan
what's motion
Maurice Reply
what are the types of wave
Maurice
answer
Magreth
progressive wave
Magreth
hello friend how are you
Muhammad Reply
fine, how about you?
Mohammed
hi
Mujahid
A string is 3.00 m long with a mass of 5.00 g. The string is held taut with a tension of 500.00 N applied to the string. A pulse is sent down the string. How long does it take the pulse to travel the 3.00 m of the string?
yasuo Reply
Who can show me the full solution in this problem?
Reofrir Reply
Got questions? Join the online conversation and get instant answers!
Jobilize.com Reply

Get Jobilize Job Search Mobile App in your pocket Now!

Get it on Google Play Download on the App Store Now


Source:  OpenStax, College physics. OpenStax CNX. Jul 27, 2015 Download for free at http://legacy.cnx.org/content/col11406/1.9
Google Play and the Google Play logo are trademarks of Google Inc.

Notification Switch

Would you like to follow the 'College physics' conversation and receive update notifications?

Ask